(本文档仅供参考)
问题
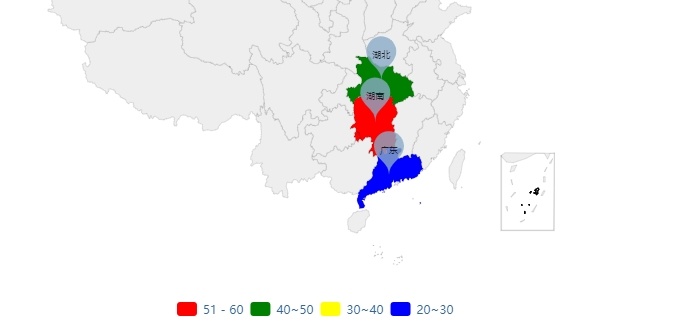
如何在地图的标记中显示区域名称,并带有分段型的图例,如要实现下图的效果:
解决方案
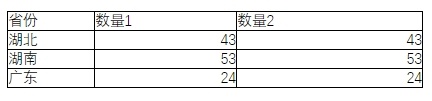
在图形对应的数据表格中增加辅助列指标列,一列指标用于散点地图,一列指标用于染色地图,两列数值一样:
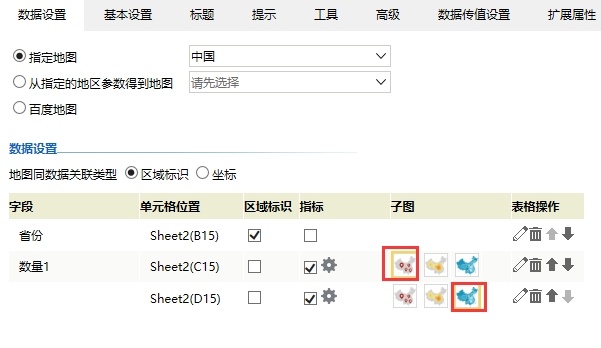
地图配置:
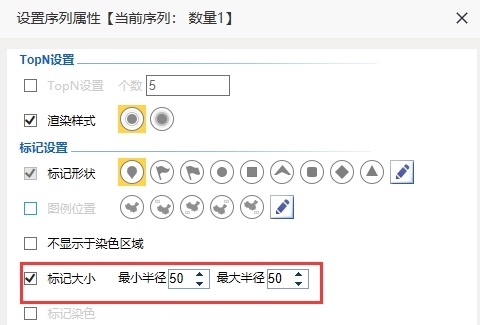
修改散点地图的标记大小:
添加扩展属性代码:
  {
    series: [{
        type: 'scatter',
        label: {
            normal: {
                show: true,
                textStyle: {
                    color: '#000', //气泡内数值颜色
                    fontSize: 9,
                },
                formatter: '{b}'
            }
        }
    }],
    visualMap: [{
        show: false
    }, {
        type: 'piecewise', //分段型。
        splitNumber: 3,
        inverse: true,
        left: 'center',
        top: 'bottom',
        orient: "horizontal",
        pieces: [{
            min: 0,
            max: 30,
            color: 'green'
        }, {
            min: 31,
            max: 40,
            color: 'yellow'
        }, {
            min: 41,
            max: 50,
            color: 'blue'
        }, {
            min: 51,
            max: 60,
            color: 'red'
        }]
    }]
    }
实现效果: