- 由 甘惠欢创建, 最终由 邹承坤修改于 五月 07, 2024
1.报表总览
1.1.背景描述
随着人口的日益增多,相关客运站的人流量不断加大,给客运站的监控管理带来了一定的难度,客运站正逐步构建智慧型监控框架,帮助管理者采用信息化的手段,提高客运站服务模式和创新性,使其能为客户提供更好的服务。
1.2.需求分析
省客运站日运行简报大屏通过值班情况分析、各指标分析、不正常情况分析、意外分析等,给客运站管理者提供精准数据支撑,使其很好的了解当前客运站值班情况、航班飞行过程中各项指标、遭遇事故或异常天气发生意外的情况等,帮助其更好进行决策,为客户提供更安全、更完善及更人性化的服务;
省客运站日运行简报大屏如下图所示:

2.定制方法
2.1.总体设计
根据需求规划大屏所需展现的内容,及需通过何组件实现最终效果,整体布局设计如下:

布局各设置项说明如下:
设置项 | 参数 | 说明 |
|---|---|---|
| 尺寸 | 1920*1080 | 根据需要投屏的屏幕大小,设置屏幕尺寸。 |
| 缩放方式 | 等比缩放宽度铺满 | 宽度铺满全屏,高度按比例自动缩放。 |
| 图形渲染器 | Canvas | 适用于图像密集型编程,如高性能图形、复杂场景的实时动画等。 |
| 主题 | 浅色主题 | 选择浅色主题,在仪表盘中上传自定义背景并选择拉伸和滚动。
|
| 配色 | #053D5B #02ECF0 | 大屏背景色选择深绿色,标题亮绿色,符合客运站运行简报主题。 组件选择浅绿色、黄色、白色、灰色等,其中有的颜色比较鲜艳可适当降低饱和度,使画面更加舒适、美观。 |

详情请参考 自适应方式 、交互式仪表盘-主题区 。
2.2. 组件详解
值班情况分析
| 组件类型 | 数据 | 定制方法 | 效果 |
|---|---|---|---|
| 文本组件 | 维度:日期、公司值班、01值班员 度量:id | 1、点击左上角 组件 > 信息 > 文本 ,选择文本组件拖入到画布区 2、选择相关字段,行、列字段如下:
标记区字段如下:
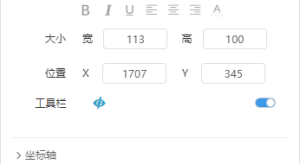
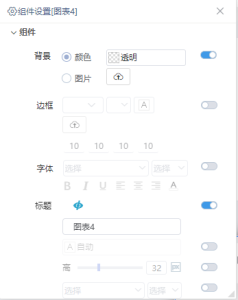
3、文本组件设置如下:
4、编辑文本组件,插入表格,表格属性如下:
单元格属性如下:
将对应字段插入到单元格中:
| 值班情况统计表:
|


当天进出港计划分析
| 组件类型 | 数据 | 定制方法 | 效果 |
|---|---|---|---|
WEB电子表格 | 维度:航班 度量:进港、出港 | 1、在 组件 > 表格 选择WEB电子表格组件拖入到画布区 2、WEB电子表格组件设置如下:
3、编辑WEB电子表格,设置表格样式、拖入相应字段、计算合计,如下所示:
| 当天进出港计划统计表:
|


正常率分析
| 组件类型 | 数据 | 定制方法 | 效果 |
|---|---|---|---|
饼图 (旅行正常率分析) | 维度:旅行正常率 度量:dou1 | 1、在左上角 组件 > 图表 > 饼图 选择“环形图”,将图形组件拖入到画布区 2、选择相关字段,标记区字段如下:
3、组件设置如下:
图例设置如下:
自定义属性如下:
展开源码
{
	"textStyle": {
		"fontFamily": "Microsoft YaHei",
		"fontWeight": "normal",
		"fontSize": 12,
		"color": "",
		"fontStyle": "normal",
		"textDecoration": "none"
	},
	"legend": {
		"left": "75%",
		"top": "48%",
		"orient": "vertical",
		"show": true,
		"content": {
			"_types": {
				"classify": true,
				"metric": false,
				"percent": false
			}
		},
		"type": "scroll",
		"itemWidth": 8,
		"itemHeight": 10,
		"icon": "roundRect",
		"textStyle": {
			"fontFamily": "Microsoft YaHei",
			"fontWeight": "normal",
			"fontSize": 10,
			"color": "rgba(255,255,255,1)",
			"fontStyle": "normal",
			"textDecoration": "none"
		}
	},
	"visualMap": {
		"left": "center",
		"top": "top",
		"orient": "horizontal",
		"show": true,
		"itemWidth": 10,
		"itemHeight": 100,
		"textStyle": {
			"fontFamily": "Microsoft YaHei",
			"fontWeight": "normal",
			"fontSize": 12,
			"color": "#515c68",
			"fontStyle": "normal",
			"textDecoration": "none"
		}
	},
	"series": [
		{
			"label": {
				"normal": {
					"show": true,
					"formatter": "{d}%"
				}
			}
		}
	],
	"roseType": ""
}
| 旅行正常率分析环图:
|
饼图 (始发正常率) | 维度:始发正常率 度量:dou1 | 1、在左上角 组件 > 图表 > 饼图 选择“环形图”,将图形组件拖入到画布区 2、选择相关字段,标记区字段如下:
3、组件设置如下:
图例设置如下:
自定义属性如下:
展开源码
{
	"textStyle": {
		"fontFamily": "Microsoft YaHei",
		"fontWeight": "normal",
		"fontSize": 12,
		"color": "",
		"fontStyle": "normal",
		"textDecoration": "none"
	},
	"legend": {
		"left": "75%",
		"top": "48%",
		"orient": "vertical",
		"show": true,
		"content": {
			"_types": {
				"classify": true,
				"metric": false,
				"percent": false
			}
		},
		"type": "scroll",
		"itemWidth": 8,
		"itemHeight": 10,
		"icon": "roundRect",
		"textStyle": {
			"fontFamily": "Microsoft YaHei",
			"fontWeight": "normal",
			"fontSize": 10,
			"color": "rgba(255,255,255,1)",
			"fontStyle": "normal",
			"textDecoration": "none"
		}
	},
	"visualMap": {
		"left": "center",
		"top": "top",
		"orient": "horizontal",
		"show": true,
		"itemWidth": 10,
		"itemHeight": 100,
		"textStyle": {
			"fontFamily": "Microsoft YaHei",
			"fontWeight": "normal",
			"fontSize": 12,
			"color": "#515c68",
			"fontStyle": "normal",
			"textDecoration": "none"
		}
	},
	"series": [
		{
			"label": {
				"normal": {
					"show": true,
					"formatter": "{d}%"
				}
			}
		}
	],
	"roseType": ""
}
| 始发正常率分析环图:
|
饼图 (客运正常率) | 维度:航班正常率 度量:dou1 | 1、在左上角 组件 > 图表 > 饼图 选择“环形图”,将图形组件拖入到画布区 2、选择相关字段,标记区字段如下:
3、组件设置如下:
图例设置如下:
自定义属性如下:
展开源码
{
	"textStyle": {
		"fontFamily": "Microsoft YaHei",
		"fontWeight": "normal",
		"fontSize": 12,
		"color": "",
		"fontStyle": "normal",
		"textDecoration": "none"
	},
	"legend": {
		"left": "75%",
		"top": "48%",
		"orient": "vertical",
		"show": true,
		"content": {
			"_types": {
				"classify": true,
				"metric": false,
				"percent": false
			}
		},
		"type": "scroll",
		"itemWidth": 8,
		"itemHeight": 10,
		"icon": "roundRect",
		"textStyle": {
			"fontFamily": "Microsoft YaHei",
			"fontWeight": "normal",
			"fontSize": 10,
			"color": "rgba(255,255,255,1)",
			"fontStyle": "normal",
			"textDecoration": "none"
		}
	},
	"visualMap": {
		"left": "center",
		"top": "top",
		"orient": "horizontal",
		"show": true,
		"itemWidth": 10,
		"itemHeight": 100,
		"textStyle": {
			"fontFamily": "Microsoft YaHei",
			"fontWeight": "normal",
			"fontSize": 12,
			"color": "#515c68",
			"fontStyle": "normal",
			"textDecoration": "none"
		}
	},
	"series": [
		{
			"label": {
				"normal": {
					"show": true,
					"formatter": "{d}%"
				}
			}
		}
	],
	"roseType": ""
}
| 客运正常率分析环图:
|


各月指标分析
| 组件类型 | 数据 | 定制方法 | 效果 |
|---|---|---|---|
| 柱图 | 维度:月份 度量:dou1 | 1、在左上角 组件 > 图表 > 柱图 选择“柱图”,将图形组件拖入到画布区 2、选择相关字段,行、列字段如下:
3、基础设置如下:
组件设置如下:
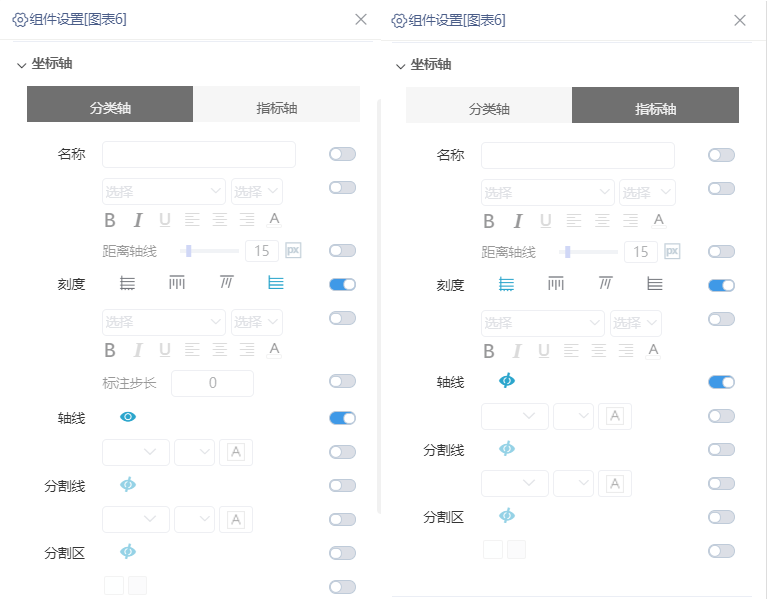
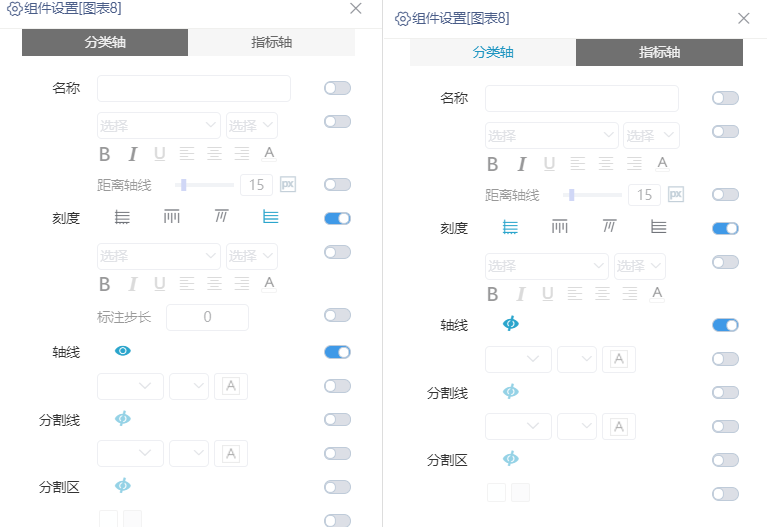
坐标轴设置如下:
自定义属性如下:
展开源码
{
	"textStyle": {
		"fontFamily": "Microsoft YaHei",
		"fontWeight": "normal",
		"fontSize": 12,
		"color": "",
		"fontStyle": "normal",
		"textDecoration": "none"
	},
	"xAxis": {
		"name": "",
		"nameTextStyle": {
			"fontFamily": "Microsoft YaHei",
			"fontWeight": "normal",
			"fontSize": 12,
			"color": "#515c68",
			"fontStyle": "normal",
			"textDecoration": "none"
		},
		"nameGap": 15,
		"axisLabel": {
			"rotate": "0",
			"show": true,
			"fontFamily": "Microsoft YaHei",
			"fontWeight": "normal",
			"fontSize": 12,
			"color": "rgba(255,255,255,1)",
			"fontStyle": "normal",
			"textDecoration": "none",
			"interval": 0
		},
		"axisLine": {
			"show": true,
			"lineStyle": {
				"type": "solid",
				"width": 2,
				"color": "rgba(4,170,170,1)"
			}
		},
		"splitLine": {
			"show": false,
			"lineStyle": {
				"type": "solid",
				"width": 1,
				"color": "#eeeeee"
			}
		},
		"splitArea": {
			"show": false,
			"areaStyle": {
				"color": [
					"#FDFEFE",
					"#F6F7F8"
				]
			}
		}
	},
	"yAxis": {
		"name": "",
		"nameTextStyle": {
			"fontFamily": "Microsoft YaHei",
			"fontWeight": "normal",
			"fontSize": 12,
			"color": "#515c68",
			"fontStyle": "normal",
			"textDecoration": "none"
		},
		"nameGap": 15,
		"axisLabel": {
			"rotate": "0",
			"show": true,
			"fontFamily": "Microsoft YaHei",
			"fontWeight": "normal",
			"fontSize": 12,
			"color": "rgba(255,255,255,1)",
			"fontStyle": "normal",
			"textDecoration": "none"
		},
		"axisLine": {
			"show": true,
			"lineStyle": {
				"type": "solid",
				"width": 2,
				"color": "rgba(4,170,170,1)"
			}
		},
		"splitLine": {
			"show": false,
			"lineStyle": {
				"type": "solid",
				"width": 1,
				"color": "#eeeeee"
			}
		},
		"splitArea": {
			"show": false,
			"areaStyle": {
				"color": [
					"#FDFEFE",
					"#F6F7F8"
				]
			}
		}
	},
	"legend": {
		"left": "center",
		"top": "top",
		"orient": "horizontal",
		"show": true,
		"type": "scroll",
		"itemWidth": 10,
		"itemHeight": 10,
		"icon": "roundRect",
		"textStyle": {
			"fontFamily": "Microsoft YaHei",
			"fontWeight": "normal",
			"fontSize": 10,
			"color": "#999999",
			"fontStyle": "normal",
			"textDecoration": "none"
		}
	},
	"visualMap": {
		"left": "center",
		"top": "top",
		"orient": "horizontal",
		"show": true,
		"itemWidth": 10,
		"itemHeight": 100,
		"textStyle": {
			"fontFamily": "Microsoft YaHei",
			"fontWeight": "normal",
			"fontSize": 12,
			"color": "#515c68",
			"fontStyle": "normal",
			"textDecoration": "none"
		}
	},
	"series": [
		{
			"type": "bar",
			"markLine": {
				"symbol": [
					"circle",
					"arrow"
				],
				"label": {
					"show": true,
					"normal": {
						"show": true,
						"formatter": "{c}"
					}
				}
			}
		}
	]
}
| 各月指标分析柱图:
|


公共区域及设备参数分析
| 组件类型 | 数据 | 定制方法 | 效果 |
|---|---|---|---|
| 雷达图 | 维度:var1 度量:dou1 | 1、在 组件 > 图表 > 高级 选择“棱角面积雷达图”,将图形组件拖入到画布区 2、选择相关字段,行、列字段如下:
3、基础设置如下:
组件设置如下:
 自定义属性如下:
展开源码
{
	"radar": {
		"radius": "75%",
		"splitNumber": 5,
		"axisLine": {
			"show": true,
			"lineStyle": {
				"type": "solid",
				"width": 1,
				"color": "rgba(255,255,255,1)"
			}
		},
		"splitLine": {
			"show": true,
			"lineStyle": {
				"type": "solid",
				"width": 1,
				"color": "rgba(255,255,255,1)"
			}
		},
		"splitArea": {
			"show": true,
			"areaStyle": {
				"color": [
					"rgba(85,116,137,1)",
					"rgba(85,116,137,1)"
				]
			}
		},
		"shape": "polygon",
		"name": {
			"show": false
		}
	},
	"textStyle": {
		"fontFamily": "Microsoft YaHei",
		"fontWeight": "normal",
		"fontSize": 12,
		"color": "",
		"fontStyle": "normal",
		"textDecoration": "none"
	},
	"legend": {
		"left": "center",
		"top": "top",
		"orient": "horizontal",
		"show": true,
		"type": "scroll",
		"itemWidth": 10,
		"itemHeight": 10,
		"icon": "roundRect",
		"textStyle": {
			"fontFamily": "Microsoft YaHei",
			"fontWeight": "normal",
			"fontSize": 10,
			"color": "#999999",
			"fontStyle": "normal",
			"textDecoration": "none"
		}
	},
	"visualMap": {
		"left": "center",
		"top": "top",
		"orient": "horizontal",
		"show": true,
		"itemWidth": 10,
		"itemHeight": 100,
		"textStyle": {
			"fontFamily": "Microsoft YaHei",
			"fontWeight": "normal",
			"fontSize": 12,
			"color": "#515c68",
			"fontStyle": "normal",
			"textDecoration": "none"
		}
	},
	"series": [
		{
			"itemStyle": {
				"normal": {
					"lineStyle": {
						"color": "#D0021B"
					}
				}
			}
		}
	]
}
| 公共区域分析雷达图:
|
| 雷达图 | 维度:雷达图2 度量:dou1 | 1、在 组件 > 图表 > 高级 选择“棱角面积雷达图”,将图形组件拖入到画布区 2、选择相关字段,行、列字段如下:
3、基础设置如下:
组件设置如下:
 自定义属性如下:
展开源码
{
	"radar": {
		"radius": "75%",
		"splitNumber": 5,
		"axisLine": {
			"show": true,
			"lineStyle": {
				"type": "solid",
				"width": 1,
				"color": "rgba(255,255,255,1)"
			}
		},
		"splitLine": {
			"show": true,
			"lineStyle": {
				"type": "solid",
				"width": 1,
				"color": "rgba(255,255,255,1)"
			}
		},
		"splitArea": {
			"show": true,
			"areaStyle": {
				"color": [
					"rgba(85,116,137,1)",
					"rgba(85,116,137,1)"
				]
			}
		},
		"shape": "polygon",
		"name": {
			"show": false
		}
	},
	"textStyle": {
		"fontFamily": "Microsoft YaHei",
		"fontWeight": "normal",
		"fontSize": 12,
		"color": "",
		"fontStyle": "normal",
		"textDecoration": "none"
	},
	"legend": {
		"left": "center",
		"top": "top",
		"orient": "horizontal",
		"show": true,
		"type": "scroll",
		"itemWidth": 10,
		"itemHeight": 10,
		"icon": "roundRect",
		"textStyle": {
			"fontFamily": "Microsoft YaHei",
			"fontWeight": "normal",
			"fontSize": 10,
			"color": "#999999",
			"fontStyle": "normal",
			"textDecoration": "none"
		}
	},
	"visualMap": {
		"left": "center",
		"top": "top",
		"orient": "horizontal",
		"show": true,
		"itemWidth": 10,
		"itemHeight": 100,
		"textStyle": {
			"fontFamily": "Microsoft YaHei",
			"fontWeight": "normal",
			"fontSize": 12,
			"color": "#515c68",
			"fontStyle": "normal",
			"textDecoration": "none"
		}
	},
	"series": [
		{
			"itemStyle": {
				"normal": {
					"lineStyle": {
						"color": "#D0021B"
					}
				}
			}
		}
	]
}
| 设备参数分析雷达图:
|


各抽样峰值指标分析
| 组件类型 | 数据 | 定制方法 | 效果 |
|---|---|---|---|
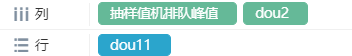
| 柱图 | 维度:dou11 度量:dou2、抽样值机排队峰值 | 1、在左上角 组件 > 图表 > 柱图 选择“横条图”,将图形组件拖入到画布区 2、选择相关字段,行、列字段如下:
3、组件设置如下:
 坐标轴设置如下:
自定义属性如下:
展开源码
{
	"textStyle": {
		"fontFamily": "Microsoft YaHei",
		"fontWeight": "normal",
		"fontSize": 12,
		"color": "",
		"fontStyle": "normal",
		"textDecoration": "none"
	},
	"xAxis": {
		"name": "",
		"nameTextStyle": {
			"fontFamily": "Microsoft YaHei",
			"fontWeight": "normal",
			"fontSize": 12,
			"color": "#515c68",
			"fontStyle": "normal",
			"textDecoration": "none"
		},
		"nameGap": {
			"val": 15,
			"isPx": true
		},
		"axisLabel": {
			"rotate": "0",
			"show": false,
			"fontFamily": "Microsoft YaHei",
			"fontWeight": "normal",
			"fontSize": 12,
			"color": "#515c68",
			"fontStyle": "normal",
			"textDecoration": "none",
			"interval": 0
		},
		"axisLine": {
			"show": true,
			"lineStyle": {
				"type": "solid",
				"width": 1,
				"color": "#999"
			}
		},
		"splitLine": {
			"show": false,
			"lineStyle": {
				"type": "solid",
				"width": 1,
				"color": "#eeeeee"
			}
		},
		"splitArea": {
			"show": false,
			"areaStyle": {
				"color": [
					"#FDFEFE",
					"#F6F7F8"
				]
			}
		},
		"show": false
	},
	"yAxis": {
		"name": "",
		"nameTextStyle": {
			"fontFamily": "Microsoft YaHei",
			"fontWeight": "normal",
			"fontSize": 12,
			"color": "#515c68",
			"fontStyle": "normal",
			"textDecoration": "none"
		},
		"nameGap": {
			"val": 15,
			"isPx": true
		},
		"axisLabel": {
			"rotate": "0",
			"show": true,
			"fontFamily": "Microsoft YaHei",
			"fontWeight": "normal",
			"fontSize": 12,
			"color": "#515c68",
			"fontStyle": "normal",
			"textDecoration": "none"
		},
		"axisLine": {
			"show": false,
			"lineStyle": {
				"type": "solid",
				"width": 1,
				"color": "#999"
			}
		},
		"splitLine": {
			"show": false,
			"lineStyle": {
				"type": "solid",
				"width": 1,
				"color": "#eeeeee"
			}
		},
		"splitArea": {
			"show": false,
			"areaStyle": {
				"color": [
					"#FDFEFE",
					"#F6F7F8"
				]
			}
		},
		"type": "category",
		"axisTick": {
			"show": false
		}
	},
	"legend": {
		"left": "center",
		"top": "top",
		"orient": "horizontal",
		"show": true,
		"type": "scroll",
		"itemWidth": 10,
		"itemHeight": 10,
		"icon": "roundRect",
		"textStyle": {
			"fontFamily": "Microsoft YaHei",
			"fontWeight": "normal",
			"fontSize": 10,
			"color": "#999999",
			"fontStyle": "normal",
			"textDecoration": "none"
		}
	},
	"visualMap": {
		"left": "center",
		"top": "top",
		"orient": "horizontal",
		"show": true,
		"itemWidth": 10,
		"itemHeight": 100,
		"textStyle": {
			"fontFamily": "Microsoft YaHei",
			"fontWeight": "normal",
			"fontSize": 12,
			"color": "#515c68",
			"fontStyle": "normal",
			"textDecoration": "none"
		}
	},
	"series": [
		{
			"type": "bar",
			"barGap": "-100%",
			"label": {
				"normal": {
					"show": false,
					"position": "right",
					"color": "#fff",
					"fontSize": 14
				}
			},
			"barWidth": "33%",
			"itemStyle": {
				"normal": {
					"borderColor": "#4DCEF8",
					"borderWidth": 2,
					"barBorderRadius": 15,
					"color": "rgba(102, 102, 102,0)"
				}
			},
			"z": 1
		},
		{
			"type": "bar",
			"barGap": "-98%",
			"barWidth": "30%",
			"itemStyle": {
				"normal": {
					"barBorderRadius": 16,
					"color": {
						"type": "linear",
						"x": 0,
						"x1": 1,
						"colorStops": [
							{
								"offset": 0,
								"color": "#02ddff"
							},
							{
								"offset": 1,
								"color": "#00feff"
							}
						]
					}
				}
			},
			"max": 1,
			"label": {
				"normal": {
					"show": false,
					"position": "left",
					"color": "#fff",
					"fontSize": 14
				}
			},
			"labelLine": {
				"show": true
			},
			"z": 2
		}
	]
}
| 抽样乘车排队峰值横条图:
|
| 柱图 | 维度:dou12 度量:dou2、抽样安检排队峰值 | 1、在左上角 组件 > 图表 > 柱图 选择“横条图”,将图形组件拖入到画布区 2、选择相关字段,行、列字段如下:
3、组件设置如下:
坐标轴设置如下:
自定义属性如下:
展开源码
{
	"textStyle": {
		"fontFamily": "Microsoft YaHei",
		"fontWeight": "normal",
		"fontSize": 12,
		"color": "",
		"fontStyle": "normal",
		"textDecoration": "none"
	},
	"xAxis": {
		"name": "",
		"nameTextStyle": {
			"fontFamily": "Microsoft YaHei",
			"fontWeight": "normal",
			"fontSize": 12,
			"color": "#515c68",
			"fontStyle": "normal",
			"textDecoration": "none"
		},
		"nameGap": {
			"val": 15,
			"isPx": true
		},
		"axisLabel": {
			"rotate": "0",
			"show": false,
			"fontFamily": "Microsoft YaHei",
			"fontWeight": "normal",
			"fontSize": 12,
			"color": "#515c68",
			"fontStyle": "normal",
			"textDecoration": "none",
			"interval": 0
		},
		"axisLine": {
			"show": true,
			"lineStyle": {
				"type": "solid",
				"width": 1,
				"color": "#999"
			}
		},
		"splitLine": {
			"show": false,
			"lineStyle": {
				"type": "solid",
				"width": 1,
				"color": "#eeeeee"
			}
		},
		"splitArea": {
			"show": false,
			"areaStyle": {
				"color": [
					"#FDFEFE",
					"#F6F7F8"
				]
			}
		},
		"show": false
	},
	"yAxis": {
		"name": "",
		"nameTextStyle": {
			"fontFamily": "Microsoft YaHei",
			"fontWeight": "normal",
			"fontSize": 12,
			"color": "#515c68",
			"fontStyle": "normal",
			"textDecoration": "none"
		},
		"nameGap": {
			"val": 15,
			"isPx": true
		},
		"axisLabel": {
			"rotate": "0",
			"show": true,
			"fontFamily": "Microsoft YaHei",
			"fontWeight": "normal",
			"fontSize": 12,
			"color": "#515c68",
			"fontStyle": "normal",
			"textDecoration": "none"
		},
		"axisLine": {
			"show": false,
			"lineStyle": {
				"type": "solid",
				"width": 1,
				"color": "#999"
			}
		},
		"splitLine": {
			"show": false,
			"lineStyle": {
				"type": "solid",
				"width": 1,
				"color": "#eeeeee"
			}
		},
		"splitArea": {
			"show": false,
			"areaStyle": {
				"color": [
					"#FDFEFE",
					"#F6F7F8"
				]
			}
		},
		"type": "category",
		"axisTick": {
			"show": false
		}
	},
	"legend": {
		"left": "center",
		"top": "top",
		"orient": "horizontal",
		"show": true,
		"type": "scroll",
		"itemWidth": 10,
		"itemHeight": 10,
		"icon": "roundRect",
		"textStyle": {
			"fontFamily": "Microsoft YaHei",
			"fontWeight": "normal",
			"fontSize": 10,
			"color": "#999999",
			"fontStyle": "normal",
			"textDecoration": "none"
		}
	},
	"visualMap": {
		"left": "center",
		"top": "top",
		"orient": "horizontal",
		"show": true,
		"itemWidth": 10,
		"itemHeight": 100,
		"textStyle": {
			"fontFamily": "Microsoft YaHei",
			"fontWeight": "normal",
			"fontSize": 12,
			"color": "#515c68",
			"fontStyle": "normal",
			"textDecoration": "none"
		}
	},
	"series": [
		{
			"type": "bar",
			"barGap": "-100%",
			"label": {
				"normal": {
					"show": false,
					"position": "right",
					"color": "#fff",
					"fontSize": 14
				}
			},
			"barWidth": "33%",
			"itemStyle": {
				"normal": {
					"borderColor": "#4DCEF8",
					"borderWidth": 2,
					"barBorderRadius": 15,
					"color": "rgba(102, 102, 102,0)"
				}
			},
			"z": 1
		},
		{
			"type": "bar",
			"barGap": "-98%",
			"barWidth": "30%",
			"itemStyle": {
				"normal": {
					"barBorderRadius": 16,
					"color": {
						"type": "linear",
						"x": 0,
						"x1": 1,
						"colorStops": [
							{
								"offset": 0,
								"color": "#02ddff"
							},
							{
								"offset": 1,
								"color": "#00feff"
							}
						]
					}
				}
			},
			"max": 1,
			"label": {
				"normal": {
					"show": false,
					"position": "left",
					"color": "#fff",
					"fontSize": 14
				}
			},
			"labelLine": {
				"show": true
			},
			"z": 2
		}
	]
}
| 抽样安检排队峰值横条图:
|
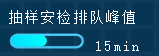
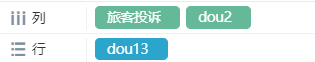
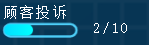
| 柱图 | 维度:dou13 度量:dou2、顾客投诉 | 1、在左上角 组件 > 图表 > 柱图 选择“横条图”,将图形组件拖入到画布区 2、选择相关字段,行、列字段如下:
3、组件设置如下:
坐标轴设置如下:
自定义属性如下:
展开源码
{
	"textStyle": {
		"fontFamily": "Microsoft YaHei",
		"fontWeight": "normal",
		"fontSize": 12,
		"color": "",
		"fontStyle": "normal",
		"textDecoration": "none"
	},
	"xAxis": {
		"name": "",
		"nameTextStyle": {
			"fontFamily": "Microsoft YaHei",
			"fontWeight": "normal",
			"fontSize": 12,
			"color": "#515c68",
			"fontStyle": "normal",
			"textDecoration": "none"
		},
		"nameGap": {
			"val": 15,
			"isPx": true
		},
		"axisLabel": {
			"rotate": "0",
			"show": false,
			"fontFamily": "Microsoft YaHei",
			"fontWeight": "normal",
			"fontSize": 12,
			"color": "#515c68",
			"fontStyle": "normal",
			"textDecoration": "none",
			"interval": 0
		},
		"axisLine": {
			"show": true,
			"lineStyle": {
				"type": "solid",
				"width": 1,
				"color": "#999"
			}
		},
		"splitLine": {
			"show": false,
			"lineStyle": {
				"type": "solid",
				"width": 1,
				"color": "#eeeeee"
			}
		},
		"splitArea": {
			"show": false,
			"areaStyle": {
				"color": [
					"#FDFEFE",
					"#F6F7F8"
				]
			}
		},
		"show": false
	},
	"yAxis": {
		"name": "",
		"nameTextStyle": {
			"fontFamily": "Microsoft YaHei",
			"fontWeight": "normal",
			"fontSize": 12,
			"color": "#515c68",
			"fontStyle": "normal",
			"textDecoration": "none"
		},
		"nameGap": {
			"val": 15,
			"isPx": true
		},
		"axisLabel": {
			"rotate": "0",
			"show": true,
			"fontFamily": "Microsoft YaHei",
			"fontWeight": "normal",
			"fontSize": 12,
			"color": "#515c68",
			"fontStyle": "normal",
			"textDecoration": "none"
		},
		"axisLine": {
			"show": false,
			"lineStyle": {
				"type": "solid",
				"width": 1,
				"color": "#999"
			}
		},
		"splitLine": {
			"show": false,
			"lineStyle": {
				"type": "solid",
				"width": 1,
				"color": "#eeeeee"
			}
		},
		"splitArea": {
			"show": false,
			"areaStyle": {
				"color": [
					"#FDFEFE",
					"#F6F7F8"
				]
			}
		},
		"type": "category",
		"axisTick": {
			"show": false
		}
	},
	"legend": {
		"left": "center",
		"top": "top",
		"orient": "horizontal",
		"show": true,
		"type": "scroll",
		"itemWidth": 10,
		"itemHeight": 10,
		"icon": "roundRect",
		"textStyle": {
			"fontFamily": "Microsoft YaHei",
			"fontWeight": "normal",
			"fontSize": 10,
			"color": "#999999",
			"fontStyle": "normal",
			"textDecoration": "none"
		}
	},
	"visualMap": {
		"left": "center",
		"top": "top",
		"orient": "horizontal",
		"show": true,
		"itemWidth": 10,
		"itemHeight": 100,
		"textStyle": {
			"fontFamily": "Microsoft YaHei",
			"fontWeight": "normal",
			"fontSize": 12,
			"color": "#515c68",
			"fontStyle": "normal",
			"textDecoration": "none"
		}
	},
	"series": [
		{
			"type": "bar",
			"barGap": "-100%",
			"label": {
				"normal": {
					"show": false,
					"position": "right",
					"color": "#fff",
					"fontSize": 14
				}
			},
			"barWidth": "33%",
			"itemStyle": {
				"normal": {
					"borderColor": "#4DCEF8",
					"borderWidth": 2,
					"barBorderRadius": 15,
					"color": "rgba(102, 102, 102,0)"
				}
			},
			"z": 1
		},
		{
			"type": "bar",
			"barGap": "-98%",
			"barWidth": "30%",
			"itemStyle": {
				"normal": {
					"barBorderRadius": 16,
					"color": {
						"type": "linear",
						"x": 0,
						"x1": 1,
						"colorStops": [
							{
								"offset": 0,
								"color": "#02ddff"
							},
							{
								"offset": 1,
								"color": "#00feff"
							}
						]
					}
				}
			},
			"max": 1,
			"label": {
				"normal": {
					"show": false,
					"position": "left",
					"color": "#fff",
					"fontSize": 14
				}
			},
			"labelLine": {
				"show": true
			},
			"z": 2
		}
	]
}
| 顾客投诉分析横条图:
|
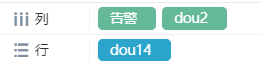
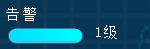
| 柱图 | 维度:dou14 度量:告警、dou2 | 1、在左上角 组件 > 图表 > 柱图 选择“横条图”,将图形组件拖入到画布区 2、选择相关字段,行、列字段如下:
3、组件设置如下:
坐标轴设置如下:
自定义属性如下:
展开源码
{
	"textStyle": {
		"fontFamily": "Microsoft YaHei",
		"fontWeight": "normal",
		"fontSize": 12,
		"color": "",
		"fontStyle": "normal",
		"textDecoration": "none"
	},
	"xAxis": {
		"name": "",
		"nameTextStyle": {
			"fontFamily": "Microsoft YaHei",
			"fontWeight": "normal",
			"fontSize": 12,
			"color": "#515c68",
			"fontStyle": "normal",
			"textDecoration": "none"
		},
		"nameGap": {
			"val": 15,
			"isPx": true
		},
		"axisLabel": {
			"rotate": "0",
			"show": false,
			"fontFamily": "Microsoft YaHei",
			"fontWeight": "normal",
			"fontSize": 12,
			"color": "#515c68",
			"fontStyle": "normal",
			"textDecoration": "none",
			"interval": 0
		},
		"axisLine": {
			"show": true,
			"lineStyle": {
				"type": "solid",
				"width": 1,
				"color": "#999"
			}
		},
		"splitLine": {
			"show": false,
			"lineStyle": {
				"type": "solid",
				"width": 1,
				"color": "#eeeeee"
			}
		},
		"splitArea": {
			"show": false,
			"areaStyle": {
				"color": [
					"#FDFEFE",
					"#F6F7F8"
				]
			}
		},
		"show": false
	},
	"yAxis": {
		"name": "",
		"nameTextStyle": {
			"fontFamily": "Microsoft YaHei",
			"fontWeight": "normal",
			"fontSize": 12,
			"color": "#515c68",
			"fontStyle": "normal",
			"textDecoration": "none"
		},
		"nameGap": {
			"val": 15,
			"isPx": true
		},
		"axisLabel": {
			"rotate": "0",
			"show": true,
			"fontFamily": "Microsoft YaHei",
			"fontWeight": "normal",
			"fontSize": 12,
			"color": "#515c68",
			"fontStyle": "normal",
			"textDecoration": "none"
		},
		"axisLine": {
			"show": false,
			"lineStyle": {
				"type": "solid",
				"width": 1,
				"color": "#999"
			}
		},
		"splitLine": {
			"show": false,
			"lineStyle": {
				"type": "solid",
				"width": 1,
				"color": "#eeeeee"
			}
		},
		"splitArea": {
			"show": false,
			"areaStyle": {
				"color": [
					"#FDFEFE",
					"#F6F7F8"
				]
			}
		},
		"type": "category",
		"axisTick": {
			"show": false
		}
	},
	"legend": {
		"left": "center",
		"top": "top",
		"orient": "horizontal",
		"show": true,
		"type": "scroll",
		"itemWidth": 10,
		"itemHeight": 10,
		"icon": "roundRect",
		"textStyle": {
			"fontFamily": "Microsoft YaHei",
			"fontWeight": "normal",
			"fontSize": 10,
			"color": "#999999",
			"fontStyle": "normal",
			"textDecoration": "none"
		}
	},
	"visualMap": {
		"left": "center",
		"top": "top",
		"orient": "horizontal",
		"show": true,
		"itemWidth": 10,
		"itemHeight": 100,
		"textStyle": {
			"fontFamily": "Microsoft YaHei",
			"fontWeight": "normal",
			"fontSize": 12,
			"color": "#515c68",
			"fontStyle": "normal",
			"textDecoration": "none"
		}
	},
	"series": [
		{
			"type": "bar",
			"barGap": "-100%",
			"label": {
				"normal": {
					"show": false,
					"position": "right",
					"color": "#fff",
					"fontSize": 14
				}
			},
			"barWidth": "33%",
			"itemStyle": {
				"normal": {
					"borderColor": "#4DCEF8",
					"borderWidth": 2,
					"barBorderRadius": 15,
					"color": "rgba(102, 102, 102,0)"
				}
			},
			"z": 1
		},
		{
			"type": "bar",
			"barGap": "-98%",
			"barWidth": "30%",
			"itemStyle": {
				"normal": {
					"barBorderRadius": 16,
					"color": {
						"type": "linear",
						"x": 0,
						"x1": 1,
						"colorStops": [
							{
								"offset": 0,
								"color": "#02ddff"
							},
							{
								"offset": 1,
								"color": "#00feff"
							}
						]
					}
				}
			},
			"max": 1,
			"label": {
				"normal": {
					"show": false,
					"position": "left",
					"color": "#fff",
					"fontSize": 14
				}
			},
			"labelLine": {
				"show": true
			},
			"z": 2
		}
	]
}
| 告警指标分析横条图:
|
累计指标分析
| 组件类型 | 数据 | 定制方法 | 效果 |
|---|---|---|---|
| 柱图 | 维度:累计指标 度量:计划、实际 | 1、在左上角 组件 > 图表 > 柱图 选择“横条图”,将图形组件拖入到画布区 2、选择相关字段,行、列字段如下:
3、基础设置如下:
组件设置如下:
 坐标轴设置如下:
| 航班累计指标分析横条图:
|


各月不正常情况分析
| 组件类型 | 数据 | 定制方法 | 效果 |
|---|---|---|---|
| 面积图 | 维度:不正常情况 度量:dou1、dou2、dou3 | 1、在左上角 组件 > 图表 > 趋势线 选择“曲线面积图”,将图形组件拖入到画布区 2、选择相关字段,行、列字段如下:
3、颜色设置如下:
基础设置如下:
组件设置如下:
坐标轴设置如下:
| 各月不正常情况分析曲线面积图:
|


意外情况分析
| 组件类型 | 数据 | 定制方法 | 效果 |
|---|---|---|---|
| 饼图 | 维度:鸟击 度量:dou1 | 1、在左上角 组件 > 图表 > 饼图 选择“饼图”,将图形组件拖入到画布区 2、选择相关字段,标记区字段如下:
3、颜色设置如下:
组件设置如下:
图例设置如下:
自定义属性如下:
展开源码
{
	"textStyle": {
		"fontFamily": "Microsoft YaHei",
		"fontWeight": "normal",
		"fontSize": 12,
		"color": "",
		"fontStyle": "normal",
		"textDecoration": "none"
	},
	"legend": {
		"left": "71%",
		"top": "48%",
		"orient": "vertical",
		"show": true,
		"content": {
			"_types": {
				"classify": true,
				"metric": false,
				"percent": false
			}
		},
		"type": "scroll",
		"itemWidth": 9,
		"itemHeight": 10,
		"icon": "roundRect",
		"textStyle": {
			"fontFamily": "Microsoft YaHei",
			"fontWeight": "normal",
			"fontSize": 10,
			"color": "rgba(255,255,255,1)",
			"fontStyle": "normal",
			"textDecoration": "none"
		}
	},
	"visualMap": {
		"left": "center",
		"top": "top",
		"orient": "horizontal",
		"show": true,
		"itemWidth": 10,
		"itemHeight": 100,
		"textStyle": {
			"fontFamily": "Microsoft YaHei",
			"fontWeight": "normal",
			"fontSize": 12,
			"color": "#515c68",
			"fontStyle": "normal",
			"textDecoration": "none"
		}
	},
	"series": [
		{
			"label": {
				"normal": {
					"show": false
				}
			}
		}
	],
	"roseType": ""
}
| 鸟击指标分析饼图:
|
| 饼图 | 维度:外来物击伤 度量:dou1 | 1、在左上角 组件 > 图表 > 饼图 选择“饼图”,将图形组件拖入到画布区 2、选择相关字段,标记区字段如下:
3、颜色设置如下:
组件设置如下:
图例设置如下:
自定义属性如下:
展开源码
{
	"textStyle": {
		"fontFamily": "Microsoft YaHei",
		"fontWeight": "normal",
		"fontSize": 12,
		"color": "",
		"fontStyle": "normal",
		"textDecoration": "none"
	},
	"legend": {
		"left": "71%",
		"top": "48%",
		"orient": "vertical",
		"show": true,
		"content": {
			"_types": {
				"classify": true,
				"metric": false,
				"percent": false
			}
		},
		"type": "scroll",
		"itemWidth": 8,
		"itemHeight": 10,
		"icon": "roundRect",
		"textStyle": {
			"fontFamily": "Microsoft YaHei",
			"fontWeight": "normal",
			"fontSize": 10,
			"color": "rgba(255,255,255,1)",
			"fontStyle": "normal",
			"textDecoration": "none"
		}
	},
	"visualMap": {
		"left": "center",
		"top": "top",
		"orient": "horizontal",
		"show": true,
		"itemWidth": 10,
		"itemHeight": 100,
		"textStyle": {
			"fontFamily": "Microsoft YaHei",
			"fontWeight": "normal",
			"fontSize": 12,
			"color": "#515c68",
			"fontStyle": "normal",
			"textDecoration": "none"
		}
	},
	"series": [
		{
			"label": {
				"normal": {
					"show": false
				}
			}
		}
	],
	"roseType": ""
}
| 外来物击伤分析饼图:
|


3.资源下载
| 名称 | 下载 |
|---|---|
| 数据资源 | demodata.rar |
| 报表资源 | |
| 图片资源 |